A progress bar is an element of graphical interface that displays the progress of a process for this very moment before it is completed. Let's take a look at the following form of such a bar.
A bar is represented as $*n*$ squares, located in line. To add clarity, let's number them with positive integers from $1$ to $*n*$ from the left to the right. Each square has saturation ($*a*_{*i*}$ for the $*i*$-th square), which is measured by an integer from $0$ to $*k*$. When the bar for some $*i*$ ($1 ≤ *i* ≤ *n*$) is displayed, squares $1, 2, ... , *i* - 1$ has the saturation $*k*$, squares $*i* + 1, *i* + 2, ... , *n*$ has the saturation $0$, and the saturation of the square $*i*$ can have any value from $0$ to $*k*$.
So some first squares of the progress bar always have the saturation $*k*$. Some last squares always have the saturation $0$. And there is no more than one square that has the saturation different from $0$ and $*k*$.
The degree of the process's completion is measured in percents. Let the process be $*t*$% completed. Then the following inequation is fulfilled:

An example of such a bar can be seen on the picture.
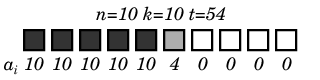
For the given $*n*$, $*k*$, $*t*$ determine the measures of saturation for all the squares $*a*_{*i*}$ of the progress bar.
Input
We are given 3 space-separated integers $*n*$, $*k*$, $*t*$ ($1 ≤ *n*, *k* ≤ 100$, $0 ≤ *t* ≤ 100$).
Output
Print $*n*$ numbers. The $*i*$-th of them should be equal to $*a*_{*i*}$.
样例
10 10 54
10 10 10 10 10 4 0 0 0 0
11 13 37
13 13 13 13 0 0 0 0 0 0 0
题面与样例版权归 Codeforces 及出题人所有;中文翻译由 AI 生成(CI 管线),如有出入请以原文为准。